
FREE SPREADSHEET TEMPLATE
Excel KPI
dashboard template.
Your results, your targets, and what changed this month. A ready-made workbook you can make your own.
- 6 editable KPIs
- 12 months
- Actuals vs. targets
- Built-in formulas & chart
MAKE IT YOURS
How to use the
KPI dashboard.
The download starts with empty input cells and working formulas. Set up your KPIs, then enter your own figures. Keep the separate example nearby if you need a reference.
Get the blank workbookChoose the numbers you review each month.
On KPI setup, set the year and currency label. Rename the six metrics and write down what each one measures. Choose a unit and whether higher or lower is better. Revenue usually needs to go up; churn and reply time need to come down.
Keep each definition consistent. If paying customers means active paid accounts at month end, use that count every month.
Add your monthly figures.
On Monthly data, fill in the empty blue cells with your actual results and targets. The month, KPI names, and units are already linked to your setup. Keep those columns and the rows in place.
Type a percentage as
12%. Leave results you haven’t measured blank, and add a note for anything you’ll want to explain later. There’s no sample data to clear first.Select a completed month.
On Dashboard, choose the reporting month at the top. The cards show that month’s actual result, target, and change from the previous calendar month.
Use a finished month for a fair comparison. Half a month of revenue will usually look low against a full month’s target.
Look at the trend, then decide what to do.
Choose a KPI above the chart to compare monthly actuals with targets. After changing a KPI’s name, select its new name here too.
A missed target is the start of a conversation. Check the note behind it, agree on the next action, and bring that action back to the following month’s review.
READING THE DASHBOARD
Up on last month.
Still short of target.
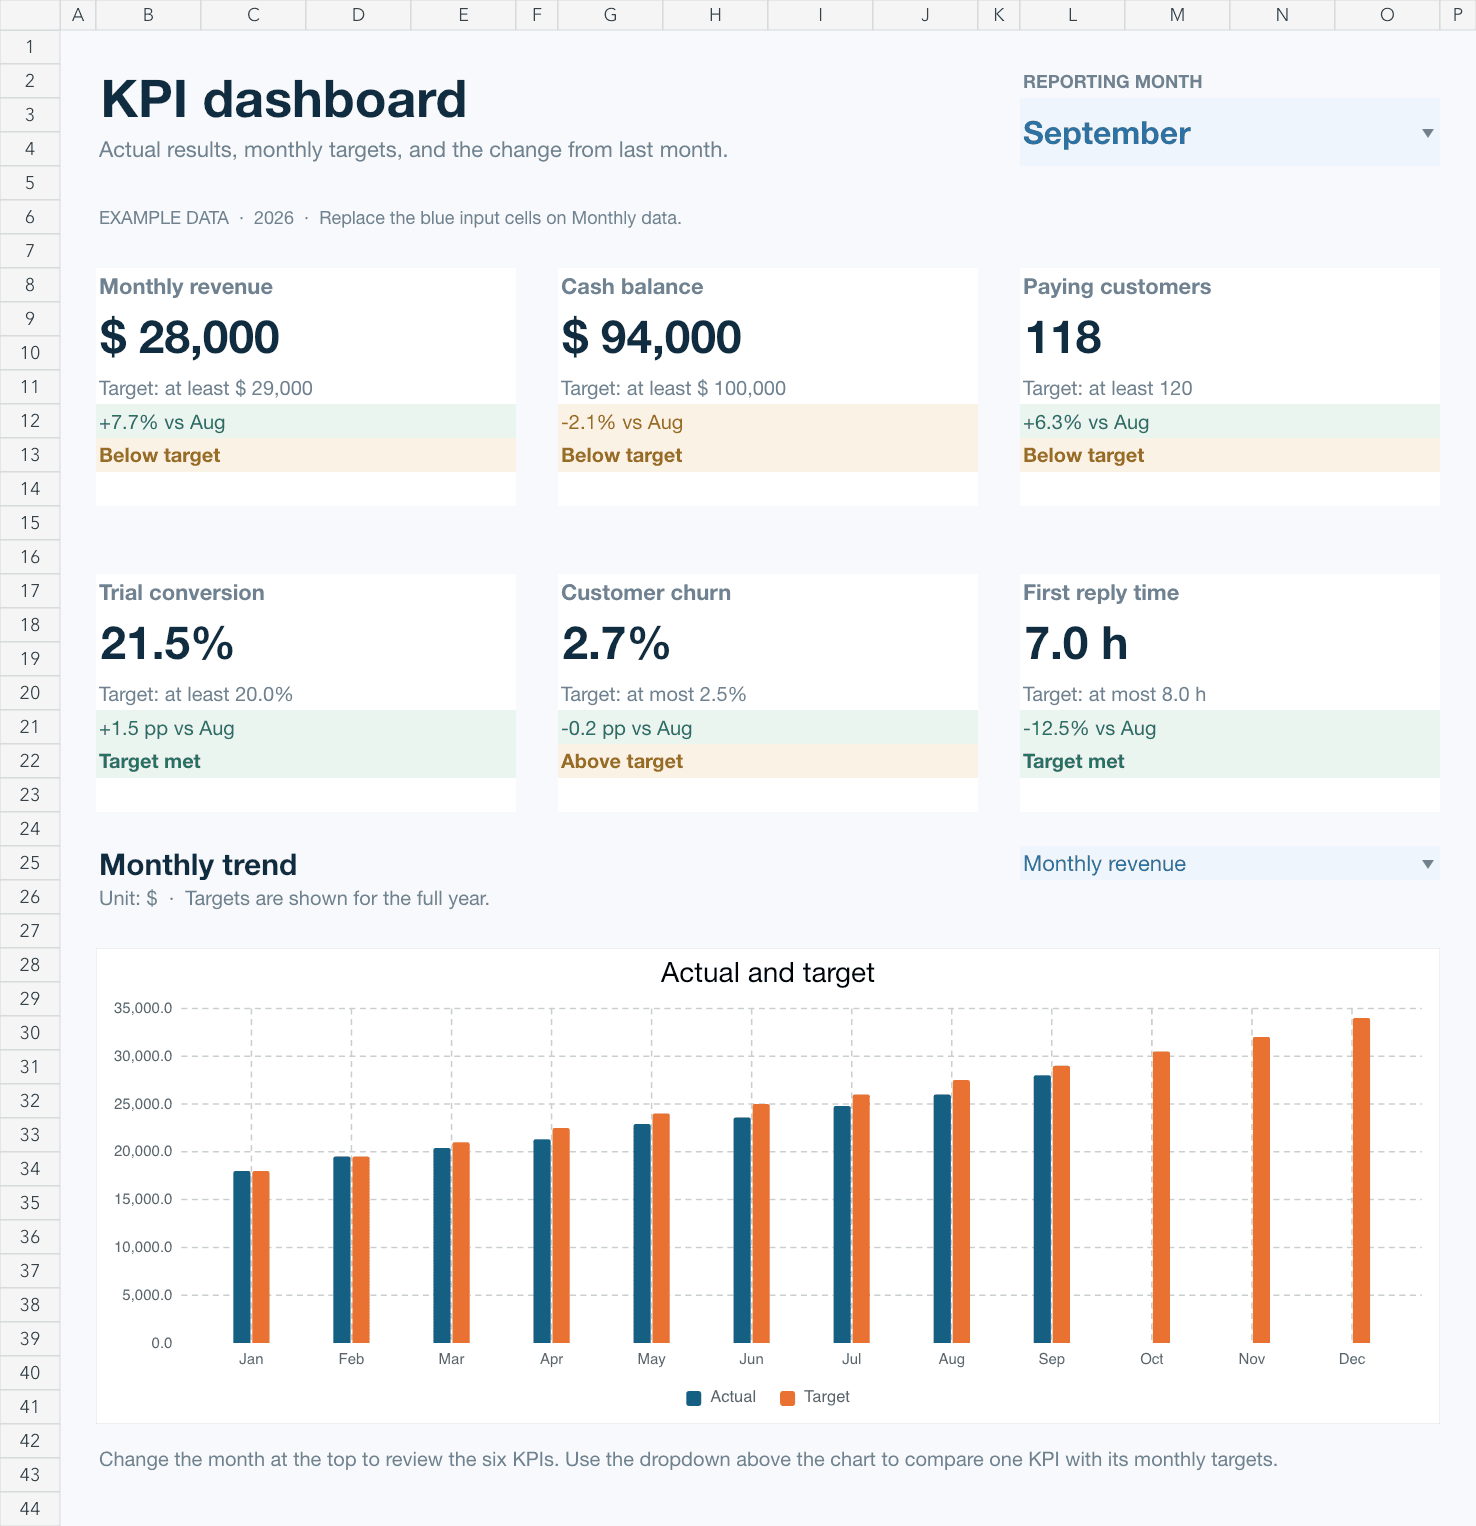
Those can both be true. The September example keeps the monthly change and target status separate, so you can see what improved and what still needs attention.
| KPI | Actual | Target | vs. August | Result |
|---|---|---|---|---|
| Monthly revenue | $28,000 | $29,000 | +7.7% | Below target |
| Cash balance | $94,000 | $100,000 | −2.1% | Below target |
| Paying customers | 118 | 120 | +6.3% | Below target |
| Trial conversion | 21.5% | 20.0% | +1.5 pp | Target met |
| Customer churn | 2.7% | 2.5% | −0.2 pp | Above target |
| First reply time | 7 hours | 8 hours | −12.5% | Target met |
Growth doesn’t mean the target was met.
Revenue rose from $26,000 to $28,000: a 7.7% increase. The target was $29,000, so the month still finished $1,000 short.
Some numbers should go down.
Churn fell from 2.9% to 2.7%, an improvement of 0.2 percentage points. It is still above the 2.5% target. Reply time, meanwhile, beat its target.
CHOOSE YOUR KPIs
Start with the decisions
you need to make.
A useful KPI dashboard helps you answer a question. Are we bringing in enough revenue? Are customers staying? Is support getting slower? Pick the measures you’ll act on, then replace the example names on KPI setup.
- Sales
- Revenue, deals won, win rate, and average deal size.
- Marketing
- Qualified leads, trial conversion, and acquisition cost.
- Customer support
- Ticket volume, first reply time, and satisfaction score.
This template takes one finished value per metric each month. Use your source reports to calculate rates or totals first, then bring those figures into the workbook.
A FEW PRACTICAL DETAILS
Using the spreadsheet.
Is this Excel KPI dashboard template free?
Yes. The main download is a blank, editable XLSX file with the dashboard, monthly data, KPI setup, and instructions. Actuals, targets, and notes are empty; the formulas, chart, and editable KPI definitions are ready to use. There’s no signup or subscription. The completed example is a separate download if you want a reference.
Can I change the KPIs?
Yes. Rename any of the six metrics on KPI setup, choose Currency, Number, Percent, or Hours, and set whether higher or lower is better. The names and units carry through to the monthly table and dashboard. After renaming a metric, select its new name in the chart dropdown. The workbook has six KPI slots; adding more requires changing the formulas and layout.
Does the dashboard update automatically?
The formulas and chart update when you enter figures or change the reporting month in Excel. The file does not connect to your accounts or import transactions. Enter the finished monthly value for each KPI in Monthly data. It uses standard formulas and a chart, with no macros.
How do I enter percentages and missing results?
For a percentage, type 12% or 0.12, not 12. Leave an unknown result blank; enter 0 only when the measured result is zero. The dashboard distinguishes missing data from zero and shows No data or No target when those inputs are missing. A missing prior-month result leaves the comparison unavailable.
Can I use it for sales, marketing, or customer support?
Yes, if you want to track six monthly figures. For sales, you could use revenue, deals won, and win rate. For marketing, leads, acquisition cost, and conversion rate may fit. For support, use ticket volume, first reply time, and satisfaction. Calculate those monthly values in your source reports first; this workbook compares the values you enter with their targets.
How do I start a new year?
Save a separate copy of the workbook to keep last year’s history. In the new copy, change the year on KPI setup, then clear the contents of F8:H79 on Monthly data and enter the new year’s targets. Changing the year alone only relabels the months; it does not erase old figures. Keep the rows and formulas in place.
YOUR COPY TO KEEP
Put your numbers in.
Empty input cells. Formulas, chart, and instructions already in place.
Free XLSX download · No signup